Working with time-based data is a common requirement in Power BI reports. DAX provides a set of time intelligence functions that make it easy to perform period-based aggregations such as Month-to-Date (MTD), Quarter-to-Date (QTD), and Year-to-Date (YTD).
In this post, we'll look at a practical example using sales data, and demonstrate how to calculate MTD, QTD, and YTD metrics using DAX.
Dataset Overview
The sample dataset used in this example includes:
Before we dive into calculations, it’s essential to set up a master date table — also known as a calendar table — to enable accurate and consistent time-based analysis.
Creating a Master Date Table (Calendar Table)
Why is a Master Date Table Important?
Time intelligence functions like TOTALMTD, TOTALQTD, TOTALYTD, and others work best (and often only) when they reference a continuous date column. A master date table ensures that:
A date table can be created directly in Power BI using the following DAX expression:
Master Date =
ADDCOLUMNS(
CALENDAR(
MIN(Sales[Sales Date]),
MAX(Sales[Sales Date])
),
"Year", YEAR([Date]),
"Month Number", MONTH([Date]),
"Month Name", FORMAT([Date], "MMMM"),
"Month Short", FORMAT([Date], "MMM"),
"Day", DAY([Date]),
"Quarter", "Q" & FORMAT([Date], "Q"),
"Year-MM", FORMAT([Date], "YYYY-MM"),
"Year-Mon", FORMAT([Date], "YYYY-MMM")
)
Marking It as the Official Date Table.
Once the table is created:
This ensures Power BI recognizes the table as the official time reference for calculations.
TOTALMTD
MTD Sales = TOTALMTD(SUM(Sales[Sales Amount]), Sales[Sales Date])
TOTALMTD function sums all sales from the start of the current month up to the current date. For example, if today is April 28th, this measure will return the total of sales between April 1st and April 28th
TOTALQTD
QTD Sales = TOTALQTD(SUM(Sales[Sales Amount]), Sales[Sales Date])
TOTALQTD calculates the total sales from the start of the current quarter (e.g., April 1st for Q2) through the current date.
As of April 28th, this will include all sales from April 1st to April 28th, since we're still in the first month of the quarter.
TOTALYTD
YTD Sales = TOTALYTD(SUM(Sales[Sales Amount]), Sales[Sales Date])
With TOTALYTD, you sum all sales from January 1st of the current year through the selected date. If today is April 28th, this measure returns total sales from Jan 1st to April 28th, 2025.
Report Behavior and Output
A date slicer is included in the report, allowing users to explore time-based sales trends interactively. A supporting table shows the exact dates used in the calculations for transparency.
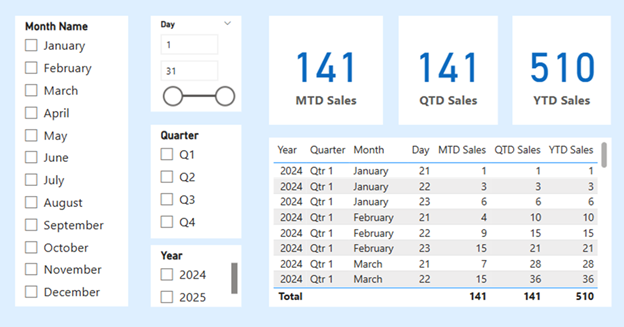
By default, when no date is selected, Power BI evaluates all time intelligence measures using the most recent available data. In our dataset, the latest entries are from April 2025, with sales amounts of:
46, 47, and 48
Since April is the first month of Q2, both Month-to-Date(MTD) and Quarter-to-Date(QTD) calculations return the same value:
For the Year-to-Date (YTD) calculation, the total includes sales from January to April 2025:
If a different period is selected using the slicer, the MTD, QTD, and YTD measures will automatically update to reflect the new time frame.
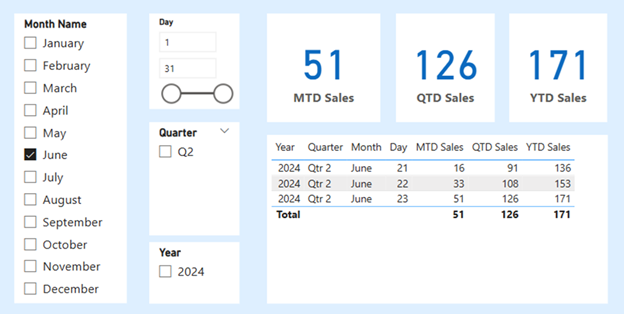
Example: Selecting June
When June 2025 is selected, it’s important to note that no sales data exists for June 2025. As a result, the calculations are based solely on the available data for June 2024. The following calculations are made accordingly:
These calculations are dynamically adjusted based on the available data and selected time frame.
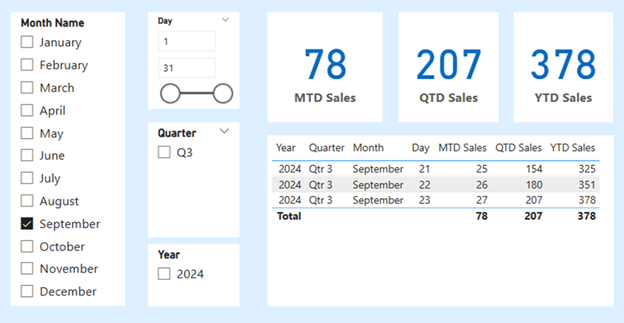
Example: Selecting June
Similarly, when September 2025 is selected, there is no sales data available for that month. As a result, only 2024 is displayed as the relevant year. Since September falls in Q3, the quarter shown will be Q3 2024.